Seattle Crime Data Visualization
Please note that this page is best viewed on a desktop.
Ever since the Licton Springs Tiny House Village was established in our neighborhood, there was an immediate outcry from all the neighbors and every crime has been blamed on the occupants of the Tiny House Village. I was curious if the crime increase we were experiencing was because of the village or if the crime had gone up in Seattle overall. So I decided to look into the data using Tableau and Seattle Police Incident reports.
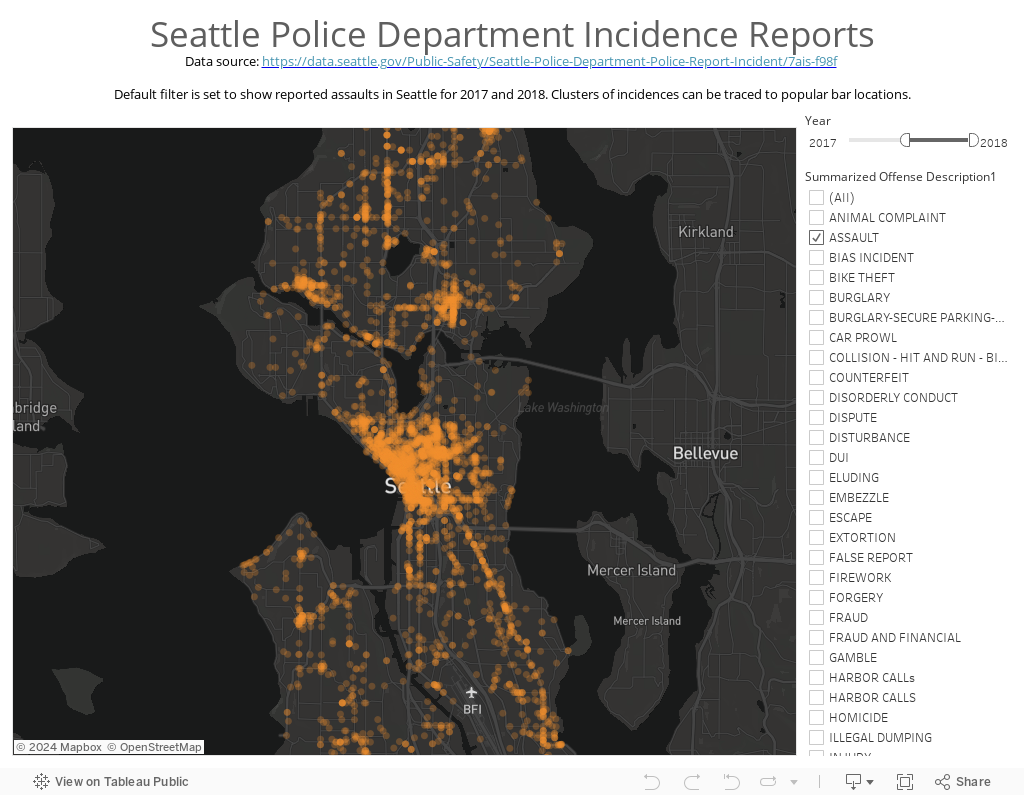
Assaults in Seattle
First I decided to visualize data on the map and see if there are any significant clusters around the city. It turns out that there is a lot of crime in Seattle and the entire map lit up like a Christmas tree. I was looking for patterns, so I decided to visualize just one category - assault reports. I was surprised to see clusters showing up in areas I didn't expect, and when I dug deeper, I realized that the assault clusters would often show up near popular bar spots. What? Turns out that alcohol and aggressive behavior go hand-in-hand. The map is interactive, so you can show or hide categories that interest you the most.
If you can't see the dashboard, try refreshing the page.
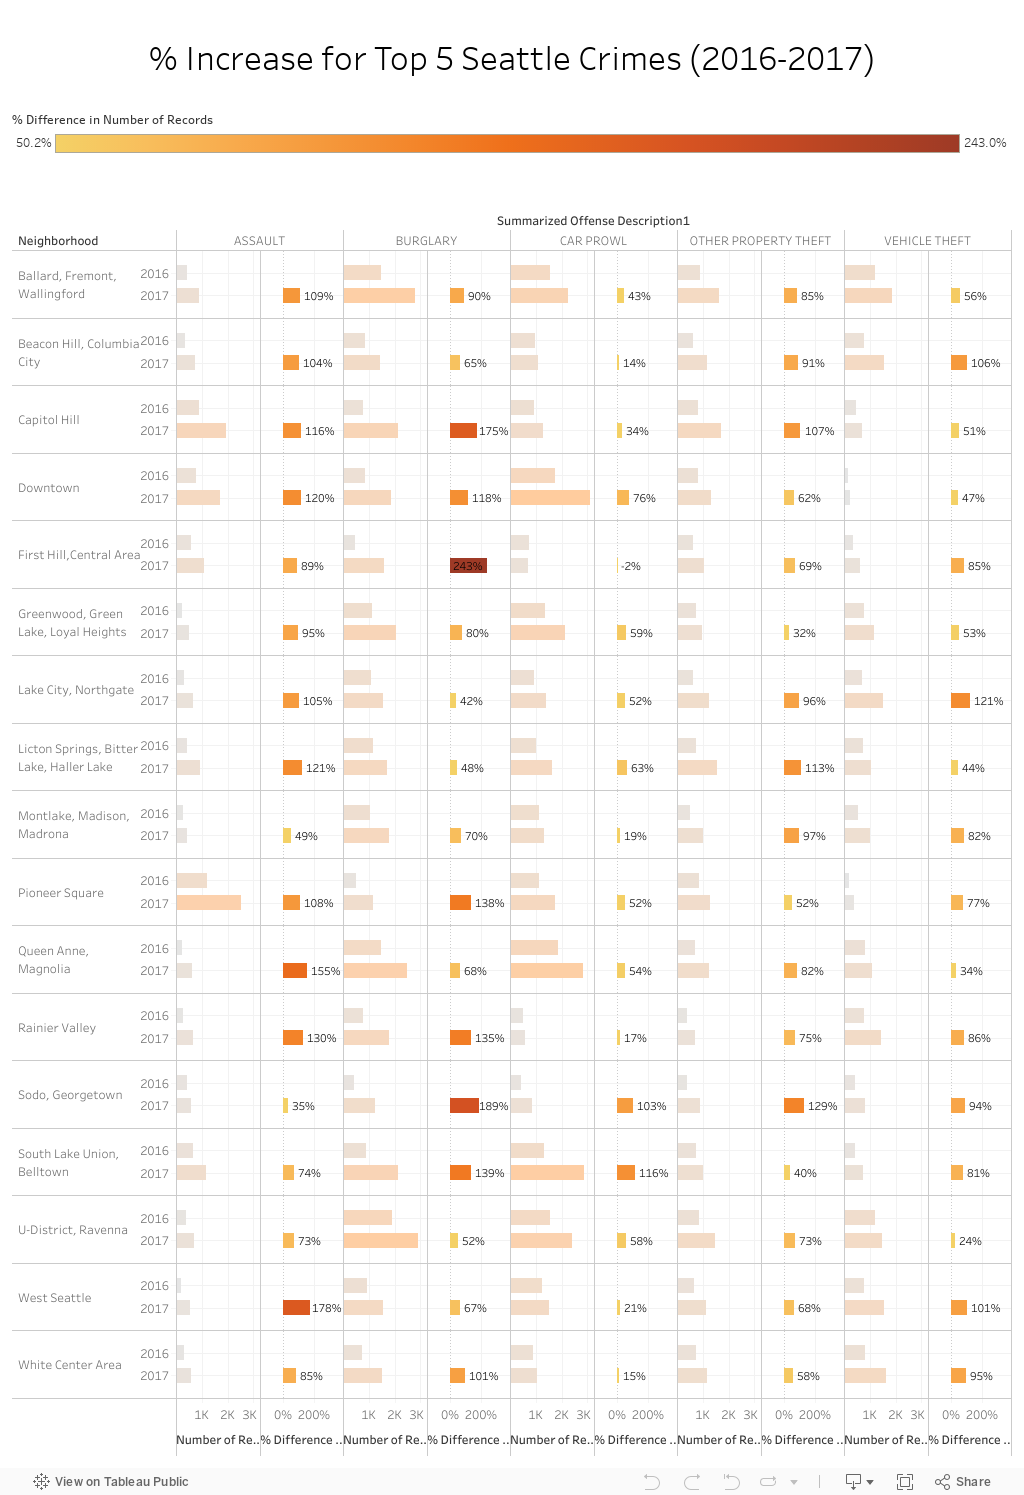
Seattle Crime by Neighborhood
Visualizing assault data was fun, and the map is beautiful, but it didn't answer the question of the crime growth in my neighborhood vs. the rest of the Seattle. I wanted to see how the crime was growing (or not) by neighborhood. Seattle Police Department divides the city into sectors and beats, so to understand where crime is happening, I mapped the police beats to Seattle neighborhoods (note that this is more of an art than science) and looked at the percentage change in the top 5 crime categories in 2017 as compared to 2016. Here are some interesting findings:
- Assault had grown the most in West Seattle (178%), Queen Anne (155%), and Rainier Valley (130%).
- Burglary skyrocketed the most in First Hill and Central Area (243%), SODO and Georgetown (189%), and Capitol Hill (175%).
- Car prowling was the worst in South Lake Union and Belltown (116%), SODO and Georgetown (103%), and Downtown (76%).
- Other property theft (this is where your mail package theft is) increased the most in SODO and Georgetown (129%), Licton Springs, Bitter Lake, Haller Lake (113%), and Capitol Hill (107%).
- Vehicle theft was the worst in Lake City and Northgate (121%), Beacon Hill and Columbia City (106%), and West Seattle (101%).
It looks like crime is growing all around Seattle, although we are experiencing relatively high other property theft.